ARIANA is a generic graphical-user interface designed to
provide Arena simulation users with a friendly and intuitive means
of interacting with simulation models. ARIANA easily manages
model inputs, scenarios, and outputs of Arena models.
It advises the user on adequacy of number of replications and
performs t-tests to compare system scenarios. ARIANA allows
users to change input parameter values, set up and run experiments,
and retrieve/view the results in spreadsheet view as well as
graphical view, without the need to interact with the simulation
model directly.
ARIANA was developed by utilizing over 20 years of expertise in
development of simulation models and simulation-based decision
support solutions to fulfill the needs of modelers and customers
and to streamline simulation modeling and analysis processes.
Who uses ARIANA?
ARIANA was designed for two types of users: Arena
simulation modeler "modelers" and Arena models user "users". The
"modelers" build, verify, validate, and deliver simulation models;
in some cases, they do analysis using the model, create simulation
scenarios, compare scenarios, run statistics test, and deliver
reports. The "users", on the other hand, do analysis through
building what-if scenarios, run the simulation model,
compare/analyze outputs, and create and build analysis reports.
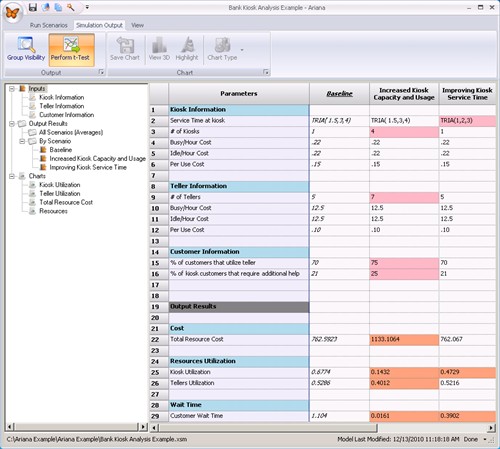
ARIANA allows you to perform two specific analyses on the
outputs of the simulation. These analyses are:
1- T-test (Unequal sample sizes, unequal variance) for
determining if there is a significant difference between the values
of the output parameters. In ARIANA, when t-test is selected, the
output parameters that are significantly different from "Baseline"
output parameters will be highlighted.
2- Precision Test for assessing adequacy of the number of
replications. Precision is defined as the half-width of the
confidence interval expressed as a percentage of the cumulative
mean (Average) of the replications performed. The precision
required for an adequate number of replications will depend on user
criteria, but generally, a value between 5% and 10% is indicative
of a sufficient number of replications to obtain significant
results.
In addition to providing numerical outputs from the simulation
model, ARIANA allows users to view results in graphical form. These
graphs are populated each time ARIANA is opened using the files
specified during GUI customization.
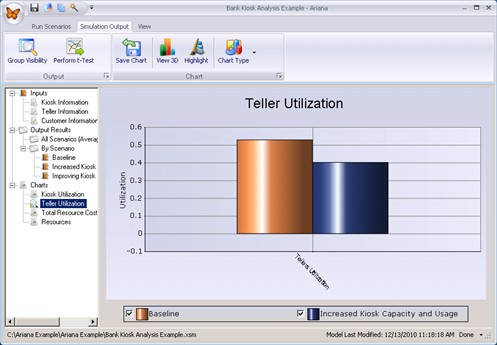
ARIANA's chart interface is designed to facilitate immediate and
painless visualization of data captured from a simulation model
across as many scenarios as the user has defined. This powerful
tool provides the means for side to side trend analysis and
comparison. Granted the copious amounts of data that can be
presented, the interface is built so the user can choose
presentation type, scale both the X and the Y axis, and choose
which scenarios to show at any given time. The user should consider
which parameters to show together in the same graph, as the chart
will automatically scale to the largest of the numbers; for best
results it is recommended that similar data be shown in the same
graph.
Benefits from Using ARIANA
- Faster delivery of analysis results, reports, and charts.
- Faster delivery of valid simulation models by an average of
30%.
- Reduction in verification and validation time by an average of
20%.
- Delivery of higher quality models and tools.
- Significant reduction in model support time by an average of
60%.
- Ability to run scenarios and generate output reports without
relying on modelers.
- Reduced possibility of errors when making changes to the model,
90-100% reduction.
- Ability for any modeler or user to run scenarios and generate
analysis reports.
- Ability to quickly create and run scenarios while also
highlighting data changes between scenarios as well as a selected
baseline scenario.
- Ability to compare simulation scenarios side by side.
- Ability to run simulation scenarios in the background, thus
being able to run hundreds of scenarios without being in front of
the computer.
- Ability to run statistical tests between scenarios such as
t-tests and highlighting statistically significant
differences.
- Ability to focus on specific output parameters.
- Ability to quickly rename input or output parameters.
For more information or product inquiries email us at
sales@productivityapex.com